
Tell Me I'm Wrong | Day 3: Zooming Doesn't Make It Bigger
Tell Me I'm Wrong | Day 3: Zooming Doesn't Make It Bigger. Didn't get the results you expected from that expensive marketing campaign you spearheaded? Don't panic. Just zoom in!...

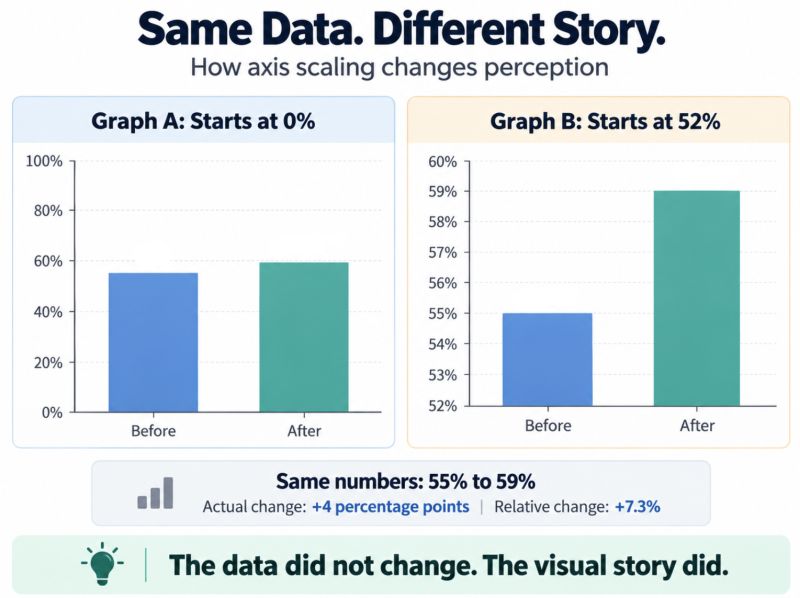
Tell Me I'm Wrong | Day 3: Zooming Doesn't Make It Bigger. Didn't get the results you expected from that expensive marketing campaign you spearheaded? Don't panic. Just zoom in! Six months ago, awareness was sitting comfortably at 55%, and you confidently told the execs, "Given how targeted this campaign is, we feel a 10pt increase to 65% in product awareness is more than achievable!" They approved your budget and 6 months later, the campaign is over, and awareness only went up to 59%. Well, shit... The executive meeting is in a few days, and you're staring at Excel wondering how you're going to explain spending half the company's annual marketing budget to deliver less than half the improvement you projected. Don't worry! I'll show you how to get out of that meeting with your head still attached! First, let's just hope nobody remembers that 10pt commitment from six months ago. Next, throw those results on a simple bar graph. "But Joe, this looks terrible!" Hold on, I haven't finished yet! Right now it's not exactly the visual you're hoping to put in front of execs, and I know that. So go to the chart settings, start that Y axis at 52% and cap it at 60%. BOOM! Your 7.3% relative increase in awareness now looks more than TWICE as tall as before the campaign! Same numbers. Same results. Completely different visual story. Now get your story straight and say "Our strategic marketing initiative generated significant positive momentum in top-of-funnel awareness, validating our targeted go-to-market approach and strengthening the foundation for customer acquisition!" Beautiful! Your missed target now sounds like a strategic victory! Don't pause though! Move quickly to the next slide, highlight some positive customer feedback, and wrap things up before anyone starts asking uncomfortable questions. Oh, this is very important! Make sure you request that all questions be held until the end. And just like that, I've saved your presentation! You're welcome. All sarcasm aside, I've spent enough time in corporate meetings to wonder whether people genuinely don't notice how data is presented or simply prefer the story they're being told. When you're more concerned with making your results LOOK successful than understanding why you missed your target, you lose out on everything that data could actually teach you. That's the data worth looking into before spending another dollar. Instead, everyone's admiring a pretty graph. That's the power of data visualization, and exactly why we need to be careful with it. You may not know you are being misled and honestly, many people don't realize they're being misleading. Excel can automatically truncate the Y-axis. So, tell me I'm wrong. I believe graphs showing percentages should almost always start at 0 and end at 100. Your audience shouldn't have to recalibrate their eyes every time someone changes the Y-axis. If you need to zoom in to make a change visible, maybe you're using the wrong graph.
Turn Strategic Clarity into Relentless Execution
Growth exposes every crack in your operational foundation. If you're an established owner-led business working 60+ hour weeks and feeling the bottleneck, let's identify the exact constraints holding your company back.